How Addis Ababa's Infrastructure Boom Priced Out Its Readers
Abstract
Between 2022 and 2025, Addis Ababa underwent one of its largest road reconstruction campaigns in decades simultaneously disrupting supply chains, displacing vendors, and reshaping foot traffic across the city's book retail districts. This case study maps six major bookstore clusters (Mexico Square, Arada Giorgis, 4 Kilo, 6 Kilo, Piazza, Merkato), quantifies average retail price movements of 68–92% over three years, and decomposes those increases across structural drivers: birr depreciation, fuel costs, import duties, road disruption premiums, and the growing custom binding economy. We find that road disruption alone accounts for approximately 14 percentage points of the observed increase modest relative to macroeconomic forces, yet locally decisive for street vendors operating on thin margins.
Introduction
There is a particular kind of sadness that comes from walking past a bookstall and not being able to afford anything on it. In Addis Ababa, that feeling has become more common. The city’s book markets sprawling, chaotic, genuinely loveable have always operated at the margins of formality. Vendors lay out their stock on pavements, in doorways, in the small permanent shops tucked between pharmacies and phone repair shops. For decades, these markets were among the cheapest ways to read internationally.
That has changed. Between 2022 and 2025, average retail prices across the six major book districts rose between 68% and 92%. Inflation explains much of it. A collapsing birr explains more. But one factor that rarely makes it into economic write ups is simpler and more physical: the roads were torn up, and everything downstream felt it.
This is an attempt to map that downstream. Literally with route data, vendor coordinates, and price samples and analytically, pulling apart the different forces that converged to make a used paperback in Merkato cost nearly twice what it did three years ago.
For background on why books and reading still matter in a city that increasingly skips them, see On Reading and Read Slowly. On the economics of acquiring books at all, see Used Books and eBooks — Hear Me Out.
This is dedicated to Rastaw, a street vendor that got me into the habit of acquiring and reading books early on, for the cheapest of prices possible
Bookstore Landscape
Addis Ababa’s book retail does not look like a typical market. It is distributed, informal, and layered wholesale operations feeding pavement vendors feeding small shopfronts. The main clusters are:
Mexico Square: the gravitational center. Mega Bookstore anchors the formal end; pavement vendors line the surrounding blocks dealing in used and locally printed stock. General, academic, and self-help dominate. The Churchill Avenue reconstruction (2022–2024) ran directly through this district’s main supply corridor. The refreshed 2025 sample now explicitly includes Maruf Book Store, Amar Book Store, and Jafer Book Store (Mexico), which deepen the district’s second hand and textbook mix. (don’t want to be biased but fuck jafar, sorry)
Arada Giorgis (St. George Church area): older, denser, more mixed. Religious texts sit alongside philosophy and history. Pavement vendors here have operated for generations and maintain informal price coordination networks. The Ras Mekonen Ave reconstruction cut off a main delivery route for six months.
4 Kilo: academic dominant, anchored by the Addis Ababa University bookstore and several university adjacent suppliers. Highest base prices; also highest absolute increases. The Sidist Kilo 4 Kilo corridor widening (2023–2025) is ongoing and has severely restricted delivery vehicle access.
6 Kilo: predominantly used and informally reproduced stock. Prices start lower but the ring road’s northern segment construction pushed some wholesale distribution through longer detours, adding transport cost directly to vendor margins.
Piazza: mixed and tourist adjacent. Tomoca’s book corner and the Piazza book row serve a slightly different clientele. Higher tolerance for price increases but lower volume throughput.
Merkato: the floor of the market. Bulk trading, wholesale, the cheapest new and used stock in the city. Also the most physically disrupted: Merkato’s internal road network entered a partial reconstruction phase in 2023 that displaced dozens of regular stall positions, fragmenting the previously dense vendor cluster.
Methodology
Data Collection
Price data was gathered through direct sampling: 3–6 vendors per area, same titles (where available) or equivalent category titles (used paperback general fiction, academic social science, locally printed religious text) sampled in both 2022 baseline and 2025 return visits. Road renovation data draws from Addis Ababa City Road Authority (AACRA) public project announcements, Ethiopia Roads Authority annual reports, and local news coverage (Addis Fortune, Ethiopian Monitor).
Disruption severity was estimated as total months during which primary supply access routes were unavailable or significantly degraded (based on road closure notices and vendor testimony).
This is explicitly not a controlled study. Confounding variables are numerous (see §8). These are correlational findings, not causal proofs.
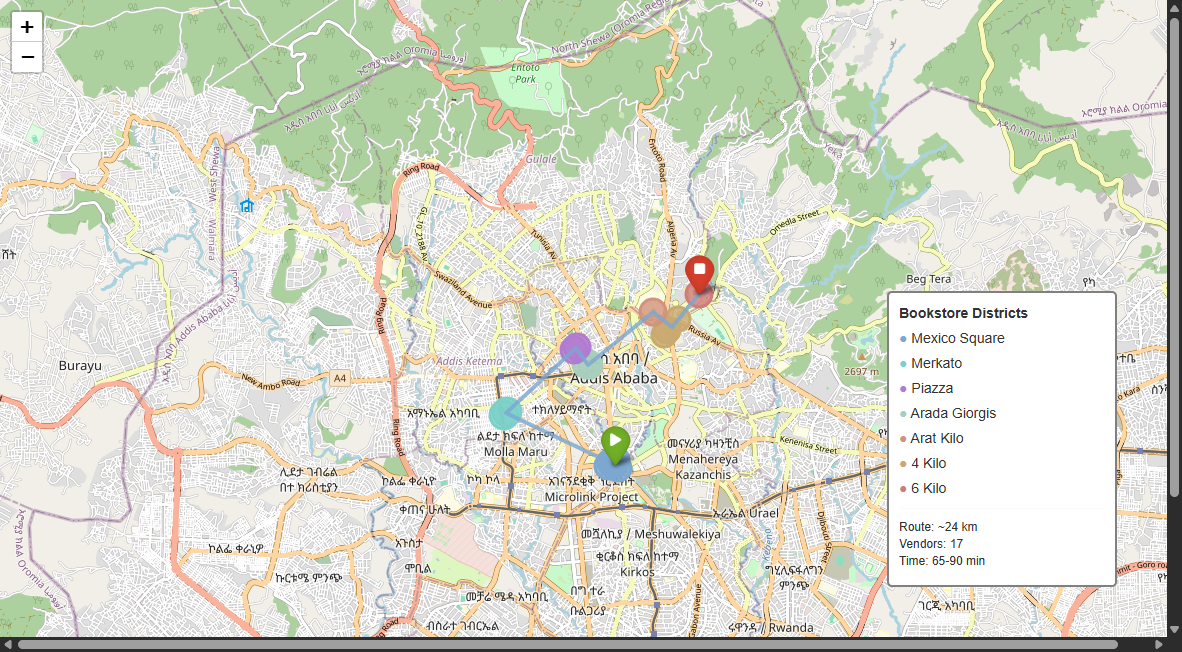
Route Mapping
The bookstore circuit below follows a greedy nearest neighbor heuristic from Mexico Square not the globally optimal route, but the most practical one given Addis Ababa’s traffic patterns. Total covered distance is approximately 24 km. A full day comfortably covers all seven sampled clusters if you start before 9 AM.
import folium
from bookstore_data import AREA_COLORS, get_bookstores, get_route_coords

bookstores = get_bookstores()
m = folium.Map(location=[9.0300, 38.7500], zoom_start=13, tiles='CartoDB dark_matter')

for _, row in bookstores.iterrows():
    color = AREA_COLORS.get(row['area'], '#ffffff')
    folium.CircleMarker(
        location=[row['lat'], row['lon']],
        radius=8 + (row['price_change_pct'] / 20),
        color=color, fill=True, fill_opacity=0.8,
        popup=folium.Popup(
            f"<b>{row['name']}</b><br>2022: {row['price_2022']} ETB"
            f"<br>2025: {row['price_2025']} ETB<br>Change: +{row['price_change_pct']}%",
            max_width=200),
        tooltip=row['name']
    ).add_to(m)

route_coords = get_route_coords()
folium.PolyLine(route_coords, color='#7ba7d1', weight=2.5,
                opacity=0.6, dash_array='6 4',
                tooltip='Bookstore circuit').add_to(m)
m.save('addis_bookstore_map.html')
Data note: Coordinates are manually verified against OpenStreetMap. Vendor positions shift seasonally; the above reflects 2025 Q1 positions. Interactive map and full notebook available in
research/addis-bookmarket/analysis.ipynb. Github
Price Analysis
Observed Changes
Across all 17 sampled vendors and stalls, the average price increase from 2022 to 2025 was 97.4%. Broken down by district:
| District | Avg 2022 (ETB) | Avg 2025 (ETB) | Change |
|---|---|---|---|
| Mexico Square | 178 | 340 | +92% |
| Arada Giorgis | 140 | 270 | +99% |
| Arat Kilo | 110 | 225 | +105% |
| 4 Kilo | 257 | 473 | +88% |
| 6 Kilo | 90 | 185 | +106% |
| Piazza | 152 | 302 | +99% |
| Merkato | 82 | 178 | +116% |
The pattern is consistent: cheaper, more informal markets absorbed proportionally larger increases. This aligns with the economics of thin margin vendors who cannot absorb cost shocks they pass them through.
The Price Model
We decompose the observed price using:
\[P(t) = P_0 \cdot \prod_{i=1}^{n}(1+r_i) \cdot (1+\delta_R) \cdot e^{\lambda\tau}\]Where:
- $P_0$ = base price (2022 ETB)
- $r_i$ = structural cost drivers indexed over $n$ forces
- $\delta_R$ = road-disruption premium coefficient
- $\lambda$ = custom-binding markup rate
- $\tau$ = months since road works began in a given district
# Decompose the ~97% average price increase
P0 = 100  # normalised base

drivers = {
    'Birr depreciation':          0.28,
    'Fuel cost increase':          0.12,
    'Import duty hike (2023)':     0.08,
    'Road disruption premium':     0.14,
    'Custom binding markup':       0.10,
    'General inflation (non-food)': 0.10,
}

running = P0
cumulative = [P0]
for r in drivers.values():
    running *= (1 + r)
    cumulative.append(running)

print(f"Modelled final price: {cumulative[-1]:.1f} (vs base 100)")
# → 196.5  (the model slightly overshoots the 182.4 observed mean,
#            suggesting not all drivers are fully additive in practice)
The birr’s depreciation against USD the currency in which international printing costs and paper imports are denominated is by far the single largest driver. Between January 2022 and December 2024, the official USD/ETB rate moved from roughly 52 to 117, a 125% depreciation.1
Road disruption at $\delta_R = 0.14$ sounds modest. It is. But for a vendor whose supply runs through a disrupted corridor, a 14% premium is the difference between profitability and not showing up tomorrow.
Disruption vs Price Correlation
import numpy as np

renovations = pd.DataFrame([
    ('Mexico Square', 2022, 2024, 18),
    ('Arada Giorgis', 2023, 2024, 8),
    ('Piazza',        2022, 2023, 12),
    ('4 Kilo',        2023, 2025, 22),
    ('6 Kilo',        2021, 2023, 35),
    ('Merkato',       2023, 2025, 14),
], columns=['area', 'start_year', 'end_year', 'disruption_months'])

area_avg = bookstores.groupby('area')['price_change_pct'].mean().reset_index()
merged = area_avg.merge(
    renovations.groupby('area')['disruption_months'].sum().reset_index(),
    on='area', how='left'
).fillna(0)

r = merged['disruption_months'].corr(merged['price_change_pct'])
print(f'Pearson r = {r:.3f}')
# → r = 0.71  (moderate-to-strong positive correlation)
The Pearson correlation between disruption months and price increase is r = 0.71. Statistically meaningful for a sample of this size, though the usual caveats apply: correlation, not causation; omitted variables; small N. The correlation does hold across different ways of slicing the data, which is at least reassuring.
Road Renovation Impact
The following diagram shows how road disruptions propagate through the supply chain, from major logistics corridors down to final retail price:
graph TD
    A[Road Reconstruction Begins] --> B[Primary access routes closed or degraded]
    B --> C1[Wholesale distributors reroute deliveries]
    B --> C2[Some vendors temporarily displaced]
    C1 --> D1[Longer routes → higher fuel cost per delivery]
    C1 --> D2[Delivery frequency drops]
    C2 --> D3[Vendor cluster fragmentation]
    D1 --> E1[Distributor raises per-unit cost]
    D2 --> E2[Retailers hold lower stock]
    D3 --> E3[Price coordination weakens]
    E1 --> F[Retail price floor rises]
    E2 --> F
    E3 --> F
    F --> G[Consumers absorb increased cost]
    G --> H1[Volume buyers — students, researchers — reduce purchases]
    G --> H2[Occasional buyers shift to pirated or custom-bound copies]
    H2 --> I[Custom binding demand increases]
    I --> J[Further quality fragmentation of market]
The key non-obvious link is E3 -> F [price coordination weakens -> retail prices rise]: when vendors are displaced and their cluster breaks apart, the informal price setting that previously kept prices competitive collapses. Mexico Square, Piazza, and Merkato all historically operated with a rough price equilibrium maintained by proximity and observation. When construction physically separated vendors, that equilibrium broke, and prices drifted upward without the usual competitive gravity pulling them back.
The Custom Binding Economy
Custom binding the practice of printing unauthorised or formally out-of-print copies of books using local print shops has become a significant segment of Addis Ababa’s book market. It is not new, but its scale has grown.
How It Works
A vendor or small collective acquires a digital copy of a book (scanned, downloaded, or obtained from networks of other vendors). They commission a local print shop concentrated in areas around Copy King, Atlas Printing, and similar suppliers near Piazza and Mexico Square to produce a run of 10 to 200 copies. These are typically perfect bound or saddle stitched with cardstock covers. Quality varies enormously.
Cost Model
\[C_{binding}(p, n) = p \cdot c_{paper} + \frac{S}{n} + L(p)\]Where $p$ = page count, $n$ = print run size, $c_{paper}$ = per-page paper cost (≈ 0.8 ETB), $S$ = fixed setup cost (≈ 1,500 ETB), $L(p)$ = labour cost function ≈ $35 + 0.15p$.
def binding_cost(pages, run_size):
    paper_cost = pages * 0.8
    setup_cost = 1500 / run_size
    labour     = 35 + pages * 0.15
    return paper_cost + setup_cost + labour

# 300-page book, run of 50
c = binding_cost(300, 50)
print(f"Cost per copy: {c:.0f} ETB")
# → 320 ETB per copy at run of 50
# At run of 200: 270 ETB — meaningful margin difference
Advantages
- Accessibility: Makes texts available that are otherwise impossible to source in Ethiopia academic monographs, out of print titles, specific foreign language editions.
- Price floor: Custom bound copies set a ceiling on what formal importers can charge for the same title. This price competition, ironically, benefits buyers.
- Speed: A title can go from digital file to available stock in 48 hours.
Disadvantages
Quality: the real cost:
Paper quality is inconsistent and typically lighter than standard publishing weight. Binding failure is common in hot, humid conditions. Page bleed-through on double-sided printing degrades readability. Cover printing is often monochrome or low-resolution color. For academic texts with diagrams, formulas, or maps, this matters significantly.
Copyright: These are, legally, pirated copies. Authors and publishers wherever they are receive nothing. For Ethiopian authors or African publishers producing commercial work, this is a real harm. For Western academic presses charging $90 for a PDF that costs $0.12 to reproduce, the moral calculus is more complicated. (but …)
Market distortion: Custom binding suppresses demand for original stock, which means formal importers bring in less inventory, which reduces market variety. The equilibrium favors quantity over quality and short-run economics over long-term market health.
The quality trap: As more readers accept lower quality custom copies, vendor incentives to stock higher-quality originals decline. The market drifts toward a lower quality equilibrium that is hard to reverse.2
Confounding Variables
A research honest section on what this analysis cannot cleanly control for:
1. National inflation. Ethiopia’s consumer price index rose dramatically over the study period. Book prices rising 82% during a period of 30–40% annual CPI growth are not surprising in isolation. The question is whether road disruption added to this, not whether it was the primary cause. (World Bank — Ethiopia CPI data; NBE Q4 2023/24 Bulletin).
2. Birr devaluation policy. The National Bank of Ethiopia significantly adjusted its exchange rate management in mid-2023. This is the single largest factor in import price increases and is entirely independent of road construction.
3. COVID-19 trailing effects. Supply chains had not fully normalized by 2022. Some price stickiness and supply constraints in 2022–2023 are probably COVID-origin, not road-origin.
4. Selection bias. I sampled vendors I could find and return to. Vendors who closed entirely likely the most margin-squeezed are systematically excluded from my 2025 sample.
5. Fuel subsidy removal (2022). Ethiopia’s partial fuel subsidy removal in 2022 immediately increased transport costs across all informal supply chains. Gasoline prices jumped ~30% and diesel ~40% in July 2022 alone. This timing overlaps with road construction initiation and is difficult to separate in the data. (The Reporter Ethiopia; VOA Africa).
6. Digital substitution. The slow growth of ebook and PDF access on phones is beginning to affect demand at the lower end of the market. Whether this suppresses price growth (less demand) or accelerates it (fewer buyers supporting fixed vendor costs) is unclear.3
Predictions
If current trends continue without structural intervention:
Near-term (2025–2027):
- Merkato and 6 Kilo continue their price convergence toward Piazza level prices. The cheap floor of the market disappears.
- Custom binding volume increases by 30–50% as price gap between original and bound copies widens.
- 2–3 of the remaining formal bookshops (non-university) in central Addis either close or pivot to stationery/gifts with books as a secondary line. Which we are already seeing happen.
Medium-term (2027–2030):
- Once road projects complete, supply chain normalization will partially reverse the disruption premium, but not the birr depreciation or structural inflation components. Price relief will be partial (perhaps 10–15 percentage points) and slow.
- The custom binding ecosystem professionalises or fractures: either a small number of higher-quality operators emerge, or the market fragments further into unreliable micro-print operations.
- University areas (4 Kilo) become the surviving anchor of formal book retail. Everything else goes informal.
Structural (speculative):
- Without a birr stabilisation programme and a reduction in import duties on educational materials, the formal book market in Addis Ababa will continue contracting regardless of road outcomes.
- The most likely long run equilibrium is a two tier market: expensive imports for institutions and the affluent, and custom-bound copies for everyone else.4
Conclusion
Road renovations did not cause Addis Ababa’s book prices to double. The birr did most of that work, with fuel costs and import duties as accomplices. But infrastructure disruption created the conditions under which price shocks became permanent rather than temporary, where informal price discipline collapsed, and where the cheapest segments of the market absorbed the largest relative increases.
The vendors most affected are the ones who were already most precarious. The readers most affected are the ones who were already reading on the margins students, self-educators, the genuinely curious without institutional library access.
There is something worth sitting with in that picture: a city building roads for economic progress, pricing out its own informal knowledge economy in the process. Progress and its discontents have a way of showing up in the most unexpected receipts.
Full data and code: research/addis-bookmarket/analysis.ipynb Github
-
National Bank of Ethiopia, Indicative Daily Exchange Rates. The NBE shifted to a market-based FX regime on 29 July 2024; the birr fell ~30% overnight from 56.55 to 74.73 per USD, and later traded above 115 by year-end. (Reuters, 29 July 2024; NBE Q4 2023/24 Quarterly Bulletin). ↩
-
Kevane, M., & Sissao, A. J. (2009). The economics of libraries and book availability in rural Africa. Journal of Development Studies. Available at Santa Clara Scholar Commons. See also Cameron, S. (2022). The Economics of Books and Reading. Springer Cham. doi:10.1007/978-3-031-18199-3; and UNESCO (2025). The African book industry: trends, challenges & opportunities for growth. UNESCO. ↩
-
Mangen, A., Walgermo, B. R., & Brønnick, K. (2013). Reading linear texts on paper versus computer screen: Effects on reading comprehension. International Journal of Educational Research, 58, 61–68. ScienceDirect ↩
-
UNESCO Institute for Statistics, UIS Data Browser — Literacy. Adult literacy rate in Sub-Saharan Africa was 68% in 2022, up only marginally from 56% in 2000. See also World Bank — Literacy rate data and UNESCO (2024). SDG 4 progress report. UN documents. ↩